Saturday, 12 March 2016

MUOS 4 recovered at 75 E

MUOS 4 at 74.8 E on 8 March 2016
image (c) by Greg Roberts, South Africa
(click to enlarge)

In a recent post I wrote that MUOS 4 (2015-044A) had left it's check-out position at 172 W near Hawaii late January, drifting westwards. I presumed that it was being moved to its assigned operational spot at 75 E, over the Indian Ocean just south of India.

This is now confirmed. On 8 March 2016, Greg Roberts from Cape Town, South Africa, recovered MUOS 4 at 74.8 E. Greg's recovery image (used with his permission) is above. As I wrote before, it probably arrived there on 29 February 2016, after a 37-day drift westwards at a rate of ~3 degrees/day.

With four satellites at their operational positions, the MUOS constellation is now complete.

MUOS 1   2012-09A       177 W  Pacific
MUOS 2   2013-036A      100 W  CONUS
MUOS 3   2015-002A     15.8 W  Atlantic

MUOS 4   2015-044A       75 E  Indian


However, one more MUOS satellite will be launched. This fifth satellite will be parked at 72 E and will function as an on-orbit spare, in case one of the other four MUOS satellites malfunctions on-orbit.


(click to enlarge)


As can be seen in the illustrations above, the MUOS satellites are separated by ~90 degrees in longitude, but with a slightly bigger gap (~108 degrees) between MUOS 1 and MUOS 4, a gap representing the Pacific. The latter is probably in order to assure access to/from at least two ground facilities, with Hawaii and California serving MUOS 1. The latter would not have been possible with MUOS 1 at ~90 rather than 108 degrees from MUOS 4. MUOS ground facilities are indicated by yellow squares in the map above.

Friday, 11 March 2016

Imaging a "UFO" (Ultra High Frequency Follow-On)

UFO F2 on 3 March 2016
(click image to enlarge)

The image above is my first image of a UFO...

(* cue X-Files tune *)

No need to call in Mulder, however. The object in the image is a geosynchronous satellite, UFO F2 (1993-056A).

The truth is out there

The acronym 'UFO' in this case does not stand for the classic Unidentified Flying Object. It stands for Ultra High Frequency (UHF) Follow-On, the name of a class of US Navy communication satellites.

The UFO satellite constellation consists of 11 satellites (not all of them operational) in geosynchronous orbit, launched between 1993 and 2003. It serves fleet-wide communication needs for the US Navy (including its submarines, but also Marine units on land). The system is currently being replaced by the newer MUOS constellation (see a previous post) and will gradually be phased out.

UFO satellite constellation on 9 March 2016
(click image to enlarge)

The first launch in the series, the launch of UFO F1 on 25 March 1993 with an Atlas 1 from Cape Canaveral, resulted in a partial failure to reach the intended geosynchronous orbit due to the failure of one of the rocket engines. The second UFO launch, UFO F2, the one imaged above, was the first truely successful launch of this satellite class.


USA 236 on 28 February 2016
(click image to enlarge)

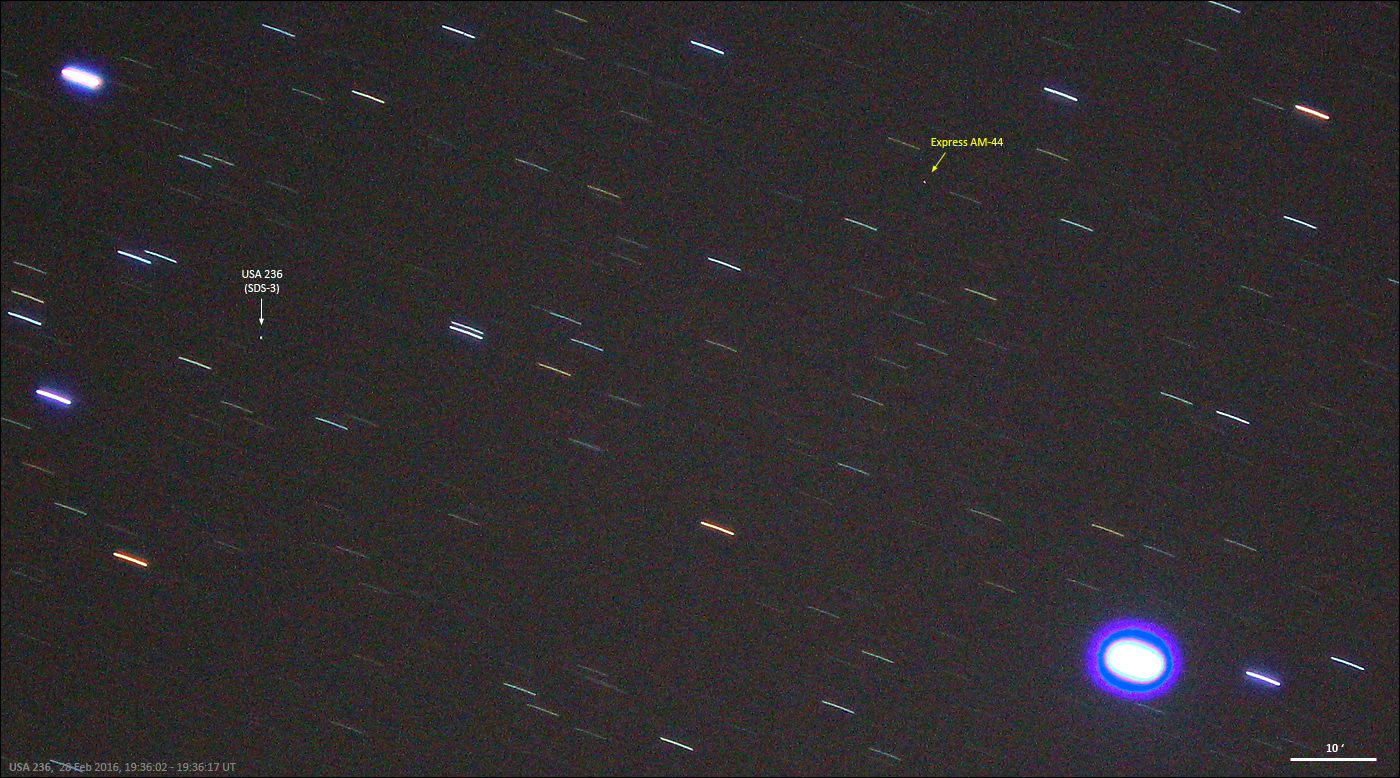
I imaged more geosynchronous objects the past week, taking advantage of clear moonless evenings. The image above shows a star field in Orion in the evening of 28 February 2016, with USA 236 (SDS 3 F7, 2012-033A), an SDS data communications satellite in geosynchronous orbit. These satellites relay data from other US military satellites, optical and radar reconnaissance satellites in Low Earth Orbits such as the KH-11 'Keyhole'/CRYSTAL, Lacrosse (ONYX) and FIA (TOPAZ), to the US.

PAN on 28 February 2016
(click image to enlarge)

I also did my periodic revisit of the enigmatic SIGINT satellite PAN (2009-047A) as well (see image above). PAN is still stable at 47.7 E (see my long-term analysis here), near Yahsat 1B. The image above shows it near that satellite and a number of other commercial communications satellites in an image taken on 28 February 2016.

Mercury 1 r on 3 March 2016
(click image to enlarge)

On Feb 28 and March 3, I recovered Mercury 1 r (1994-054B), the upper stage from the launch of the Mercury 1 SIGINT satellite. We had lost this object for a while, it had not been seen for 153 days when I recovered it. The image above shows it in Hydra on 3 March 2016.

USA 186 on 5 March 2016
(click image to enlarge)

As spring is approaching, the visibility of satellites in Low Earth Orbit is gradually coming back for northern hemisphere observers.  This means we can take over from our lone southern hemisphere observer, Greg. The image above shows the KH-11 'Keyhole'/CRYSTAL optical reconnaissance satellite USA 186 (2005-042A) imaged on 5 March 2016.

Sunday, 6 March 2016

The tumble period of the UNHA-3 upper stage from the recent North Korean launch is slowly changing

click image to enlarge

The image above, taken in the evening of 5 March 2016,  is a 10-second exposure showing several flashes of the tumbling UNHA-3/Kwangmyŏngsŏng rb 2016-009B, the upper stage from North Korea's recent Kwangmyŏngsŏng-4 launch. It was taken during a very favourable 67-degree elevation pass, using my Canon EOS 60D and a SamYang 1.4/85mm lens (set at F2.0). The sky had cleared just in time for this pass (a last wisp of clouds is still visible in the image).

The flashes had a brightness of about mag. +3.5 and were visible by the naked eye. The resulting brightness variation curve is this one:

click diagram to enlarge

I have briefly mentioned the tumbling behaviour of this rocket stage in an earlier post. Over the past week I have been following this rocket when weather allowed, obtaining observations in the evenings of Feb 28, Feb 29, March  3 and March 5. This now allows a first look at how the tumble rate is (very) slowly changing.

The theory behind tumbling rocket stages and why their tumble rate changes over time, is briefly discussed here on the satobs.org site. After the payload and the upper stage separate, usually by means of exploding bolts, the upper stage gets a momentum from this separation.

Over time, the resulting tumble is influenced by interaction of the rocket stage body with the earth's magnetic field. Spent upper stages are basically hollow metal tubes, and the Earth's magnetic field causes induction in it, leading to the tube getting an electric charge. Basically, the rocket stage becomes a dynamo. The Earth's magnetic field then further interacts with this electrically charged rocket stage, by means of the Lorentz force exerting a magnetic torque on the rocket stage's spinning motion. It is the latter effect which by "tugging" on the tumbling stage, changes its momentum, with a changing tumble period as a result. The resulting change is one towards a slower tumble rate, and eventually the stage might stop tumbling altogether.

I earlier established a peak-to-peak period of 2.39 seconds for 2009-009B from observations on Feb 28 and 29. Analysis of the new data obtained on March 3 and 5 show that the period is changing: I get 2.43 seconds for March 3 and 2.45 seconds for March 5.

I re-analyzed the Feb 28 and 29 data as well, this time using a fit to a running 5-point average on the raw data, which leads to somewhat better refined peaks. I also found that the initial autofit made by PAST is actually not the best fit, based on the r-square values of the fit. re-analysis leads to a 0.01 second revision to 2.38 seconds of the Feb 28 period, while the Feb 29 period stays at 2.39 seconds as initially established.

So the sequence is:

peak-to-peak periods
-----------------------------------
Date        TLE date    Period(sec)
-----------------------------------
Feb 28.81   16059.81    2.38 ± 0.01
Feb 29.79   16060.79    2.39 ± 0.01
Mar 03.79   16063.79    2.43 ± 0.01
Mar 05.82   16065.82    2.45 ± 0.01
-----------------------------------

(NB: the listed uncertainty is an estimate)

Even though the differences are very small, there appears to be an increasing trend to the periodicity, at the rate of about 0.01 second per day. As the difference is systematic, it is probably real and not just scatter due to measuring uncertainty (time will tell if this indeed holds).

[edit 7 March 2016 19:55]
One caveat: the synodic effect. As the viewing angle changes over the pass, this has some influence on the determined period. For fast tumblers this effect is small, but as we are talking about differences in the order of a few 0.01 seconds, the synodic effect comes into play.
The observations of Feb 28, 29 and March 3 were all made some 30 degrees beyond culmination, so the synodic effect should be about the same. The March 5 observation was done at culmination (I actually have a second image post-culmination as well but have not analysed it yet)
[end of edit]

Below are the brightness curves on which these values are based (click diagrams to enlarge):

click diagrams to enlarge


Appendix: on the construction of these brightness curves

I got a number of questions on how, and with what software, I produce these brightness curves. I will briefly explain below.

(a) calibrate exposure duration
What is first necessary, is that the real duration of the exposure is carefully calibrated. A "10-second" exposure set on your camera is not exactly 10.000 seconds: with my Canon EOS 60D for example, it is 10.05 seconds in reality (this deviation seems to increase exponentially with exposure time: a "15-second" exposure for example is in reality closer to 16 seconds!).

(b) measure pixel values with IRIS
The pixel brightness over the trail on the photograph is measured using the free astrophoto software IRIS.  Load the image, and chose "slice" from the menu option "view". Put the cursor at the start of the trail, and draw a line over the trail to the end of the trail. A window pops up with a diagram. You can save the data behind this diagram as a .txt table.
NB: be aware that Iris always measures from left to right (no matter how you draw the line), so if the satellite moved from right to left, you will later have to invert the obtained data series.

(c) Excel manipulation
The resulting .txt data file is read into excel. There, if necessary I first invert the series (see remark above). The result is a table with a column with pixel brightness values,  to which I ad an increasing pixel count. I then ad another column, representing the time for each pixel measurement. The value of the first cell is the start time of the image in seconds (I usually take the number of seconds after a whole minute, e.g. if the image started at 19:43:32.25 UT the value in this cell is "32.25". If I have a total number of pixels of say 430 (with 430 corresponding pixel brightness values), and an exposure time of 10.05 seconds, then I type this in the cell below it: "=[cell above it]+(exposure/number of pixels - 1)". In our example: "[cell above it] +(10.05/429)".
Then drag this down to the end of the column: the last value now should correspond to the end time of the exposure (in our example, it should be "42.30", i.e. 32.25 + 10.05).

If the raw data graph shows a lot of scatter, it can be useful to apply a running average to the data.

(Note: this approach assumes that the angular motion of the tumbling satellite or rocket stage was fixed over the exposure time in question. In reality, this is not the case. But for short time spans of a few seconds, this can usually be ignored, certainly if the image was taken near culmination of the object. It does introduce some deviation in the result though. Compensating for this makes the exercise a hell of a lot more complicated).

(d) read into PAST and analyse
I then copy the columns with the times and pixel brightness values, and paste them into PAST v.3 (very neat and free statistical software developed by paleontologists. I like it because it is versatile and able to create publication quality vector-format diagrams - the latter ability is something often lacking in such packages).
Press "shift" and select the two columns. Next, under "model" chose "sum-of-sinusoids". Next, a pop-up screen with a diagram appears.
Select "points" under "graph style". I leave "Phase" on "free". You then check the checkbox "fit periods" and click the "compute" button. It will fit a period.
However, I have noted that for some odd reason, the fitted period is not always the best fitting period! Check this by unchecking the "fit period" box, and in the box with the period result, varying the value from the initial fit slightly, after which you press the button "compute" again (leave the "fit period" box unchecked). Look at the R^2 values, and by trial and error find the best R^2 value. This is your actual period.
If your graph shows clearly skewed rather than sinusoidal peaks, than there is a second period interacting with the main period (for example, complex spin motion over two axis, or weaker secondary peaks present). You can try to model this by chosing "2" under "partials".

If you want a nice publishable diagram, press "graph settings" after you are done and adjust the diagram to your liking. Save it as .svg if you want to edit it further in for example Illustrator (as I do), otherwise use one of the other image formats available.

[UPDATED] MUOS 4 has been moved to its operational position at 75 E

MUOS 4 imaged while still in its check-out position at 172 W on 27 September 2015


Since September 2015, I have been periodically covering MUOS 4 (2015-044A), a newly launched military communications satellite in geostationary orbit. It was launched on 2 September 2015 and initially placed at 172 W, just west of Hawaii. This position was temporary: it is the "check-out position" where the satellite is initially placed, well situated with regard to key monitoring stations, to check if it is working okay. It stays there for a few months until this check-out is complete: then it is moved to its operational position. In the case of MUOS 4, it is known (see my earlier post and this unclassified publication) that the operational position assigned to MUOS 4 is at 75 E, south of India.

At the start of December 2015, it was announced that check-out had been completed and that the satellite would be moved to its operational position in the spring of 2016.

When I checked upon MUOS 4 on 4 December 2015 using the 0.51-m telescope of Warrumbungle obs in Australia, it was still at 172 W. For various reasons I did not get to check that position again until a few days ago. When I imaged that location on March 1, 2016, using the same Warrumbungle telescope, MUOS 4 was no longer there. It had been moved somewhere between December 4 and March 1.

This is confirmed by observations of the Russian ISON network. I received two of their MUOS 4 elsets for mid February 2016, which show the satellite drifting westwards at a rate of about 3 degrees/day. From the drift rate I reconstruct from these elsets, I find that the move from 172 W to 75 E started near 23.0 January 2016. At this drift rate, it should have reached its designated operational slot at 75 E 37 days later, on 29.0 February 2016.

[UPDATE 11 March 2016:  On March 8, Greg Roberts in South Africa recovered MUOS 4 at 74.8 E, very close to the expected position]


Monday, 29 February 2016

Imaging North Korea's new Kwangmyŏngsŏng-4 satellite, and the flash period of its UNHA-3 rb


Kwangmyŏngsŏng-4 on 28 Feb 2016
(click image to enlarge)

North Korea's recently launched new satellite (see a  previous post), Kwangmyŏngsŏng-4 (KMS-4: 2016-009A), is finally starting to make visible evening passes here at Leiden.

Yesterday evening, 28 Feb 2016 near 19:45 UT (20:45 local time), I shot the image above, one of two images showing the satellite passing near the Celestial pole. It is a short exposure of 2 seconds with the 2.8/180 mm Zeiss Sonnar lens on my Canon EOS 60D.

Below is the same image, but in black-and-white negative, showing the trail a bit better:

Kwangmyŏngsŏng-4 on 28 Feb 2016
(click image to enlarge)

The object is very faint (probably near mag +7). It needs a rather big lens (the Zeiss 2.8/180 mm has a lens diameter of 6.4 cm), which unfortunately also means a small FOV. Over the two images, a total imaging arc of ~6 seconds, it however appeared to be stable in brightness with no sign of a periodicity due to tumble. So either it is not tumbling, or if it is tumbling at all it must be a very slow tumble.

Some 16 minutes earlier, near 19:28 UT, I also imaged the upper stage of the Kwangmyŏngsŏng/UNHA-3 rocket (2016-009B) that was used to launch the satellite. This object is brighter and shows a nice tumble resulting in periodic flashes. Below are crops from three images spanning 19:28:32 - 19:28:44 UT. The brightness variation is well visible (the bright star it passes in the first image is beta Umi):

brightness variation of UNHA-3 r/b 2016-009B on 28 Feb 2016
(click image to enlarge)

A fit to the measured brightness variation over these three images shows several specular peaks at regular intervals, with a slightly asymetric profile:

click diagram to enlarge

The fit shown in red is the result of two combined sinusoids: a major period of 2.39 seconds with a minor period of 1.195 seconds superimposed (resulting in the slight asymmetry). Pixel brightness over the trails was measured with IRIS. The data were fitted using PAST.


UPDATE 1 March 2016:

I imaged both the UNHA-3 r/b and Kwangmyŏngsŏng-4 again in the evening of 29 Feb 2016. The sky conditions wer less good, and the pass was much lower in the sky. I used the 1.4/85 mm SamYang lens this time, to get a larger FOV in order to try to capture a larger arc.

KMS-4 was captured on four images (2 second exposures) between 19:19:17 - 19:19:34 UT. It was barely visible on the images, but again the brightness appeared to be stable over this 17 second time span.

The UNHA-3 r/b was also captured, and 3 images (5 second exposures) between 18:58:42 - 18:59:07 UT again showed a very nice flash pattern, fitting (like the observations of Feb 28) a flash period of 2.39 seconds:

click diagram to enlarge


The image below is a stack of these three images. The rocket stage moves from upper right to lower left in the image.

Wednesday, 24 February 2016

A consolidated answer to "Masami Kuramoto" about Resurs P1

The MH17 discussion has become extremely messy. It is a highly politicized topic, with active disinformation campaigns and trolling from both the Russian and Ukrainian sides. It is sometimes hard to discern who is honestly seeking the truth, who is honestly seeking the truth but very naive with regard to sources, and who is actively involved in peddling propaganda and disinformation.

Ever since my expert participation in the Dutch Parliament committee hearing of Jan 22, and ever since I expressed caution on this blog about certain satellite images and factually clearly incorrect statements on satellite positions released by the Russian dept. of Defense, some of the trolling has been directed at me.

I have learned not to bother too much with trolls, but when they actively and tenaciously disseminate disinformation and seriously flawed counter-arguments around one of my analysis, I reserve myself the right to a rebuttal, just to set the record straight.

In a previous post I showed that a satellite image released by Russia, purported to be a Resurs P1 image from 17 July 2014 which claimed to show Ukrainian BUK's in a field near Zaroshchens’ke, is problematic. The viewing angles of the "BUK's" in the image do not appear to fit the satellite-to-location geometry, which only allows clearly oblique viewing angles between 45 and 57.5 degrees with the horizontal, from directions ranging from northwest via west to southwest (for more details, see my earlier post in question). I therefore urged caution with regard to these images.

My post has drawn fire on twitter, notably from a twitter user nicked "Masami Kuramoto". While the nick sounds Japanese, and the twitter account claims to be located in Germany, I have a strong suspicion that the entity behind it is Russian.

Kuramoto's chosen line of attack is by questioning the accuracy of the Resurs P1 orbital information which I used. That orbital information came straight from JSpOC (formerly known as "NORAD"), argueably this world's most reliable source of orbital elements. Kuramoto basically tries to advance a claim that the JSpOC tle's for Resurs P1 are either highly inaccurate or even deliberately doctored, and that the satellite in reality passed along a somewhat different trajectory (but with a similar pass time, to match the time listed in the images), thus advocating for the existence of an imaginary trajectory that allows to reconcile the imaging angles with the published images. In order for this to be possible, it is necessary to argue that the real orbit amounts to a significantly shifted orbital plane, i.e. a shifted RAAN value, compared to the JSpOC published orbit.

In an attempt to argue this position, Kuramoto suggestively quoted from the Space-Track terms of use, taking text out of context to insinuate that JSpOC tle's were not accurate for the task:


Kuramoto kept insisting on his perceived "unreliability"of JSpOC tle's, even after I had set him straight on this:


Let me first elaborate on what I pointed out in the tweets above. Kuramoto tried to capitalize on this warning in the Space-Track User agreement:

"A TLE AVAILABLE TO THE PUBLIC SHOULD NOT BE USED FOR CONJUNCTION ASSESSMENT PREDICTION"
This statement is relevant to close encounters (with the risk of collision) of two objects in space. What this statement simply means is that it is unwise to base decisions on debris avoidance manoeuvres solely on published tle's. In such cases, very small uncertainties matter. If one uses tle's produced for the epoch of today to make a prediction on a future position of two objects (say: 3 days from now), that prediction for a moment days from now will have a small uncertainty. SGP 4 after all is only a model. These uncertainties are negligible for other purposes, but for close encounter mitigation they matter. Satellites in Low Earth Orbit move some 7 km/s, so a 0.1 second uncertainty in the time of passing a particular point in orbit, hardly something to bother about under normal circumstances, amounts to a positional uncertainty along the orbit of 700 meter. This might not seem much and for other purposes 0.1 seconds and 700 meter is negligible, but for collision avoidance it matters: it might be the difference between a miss or a hit, certainly because the other object introduces a similar uncertainty (i.e., if both objects have 0.1 second uncertainty, the uncertainty in relative distance is 2 x 700 meter = 1.4 km. So if your analysis says they will safely pass 1.4 km apart, they might in reality collide instead. Or conversely, if your analysis says they will collide, the reality might be that they pass each other at a km distance rather than colliding).

In other words: the warning by JSpOC is only relevant to a very specific situation, and concerns uncertainties that are completely negligible for the subject at hand: the position of a satellite with respect to the viewing geometry of a location on earth. The more so because the latter assessment actually uses a tle with epoch very close to the the time of interest, unlike a collision avoidance assessment of a moment more removed in future. The uncertainty pointed out, in no way can change the viewing angles to the extend that it would solve the discrepancies I pointed out in my earlier post.

Now, this could have been a simple misunderstanding, based on a lack of knowledge and insight in the matter on Kuramoto's side.

Kuramoto however next took it to a new level and suggested that JSpOC might have deliberately altered the orbital elements for Resurs P1 post-fact:
The point is: if JSpOC would have done that, the simple reality is that many people working with these data would notice it. Satellites suddenly would be at different positions than where the JSpOC orbital data would put them. Our tracking network for example, frequently catches Russian satellites as byproduct of our tracking of classified objects. On these occasions we would suddenly note large positional errors in that case, and we would even start to see UNIDS (unidentified satellites, which always have our immediate attention) that next turn out to be Russian satellites in orbits not matching their JSpOC orbit. No way that would go unnoticed.

As for the suggestion that the elements were only retrospectively altered, Kuramoto was a bit shocked to learn next that several of us (including me) actually regularly archive the full JSpOC database of orbital elements. I do so several times each month (for July 2014, I for example have archived elements from July 14 and can compare these with elements for that date retrieved from the JSpOC archive today: they are the same, they have not been restrospectively altered). In a retrospective analysis, altering the elements starting at some given date (or only altering them around a given date) would show up as a sudden change in the elements as well.So no: such a plot is simply not realistic.

After this, Kuramoto nevertheless still wished to cast doubt on the JSpOC tle's:


Notwithstanding my earlier rebuttal, he at first simply restated his already rebutted argument:

That would not do of course, and Kuramoto seems to have realized that. In order to maintain his position, Kuramoto had to grasp the next straw. He next brought up a paper by Kelso et al.:


This paper discusses what factors might introduce predictions that do deviate considerably from reality (with the focus again on the accuracy of data needed for orbital debris avoidance manoeuvres). One such case is when for example a position is based on a tle issued 4 hours ago, but the satellite in question meanwhile has actively manoeuvered to a new orbit. In that case, the predicted position indeed would be incorrect. Kuramoto (of course) tries to seize on that, but in doing so again shows a lack of insight in the matter. Whether a satellite (Resurs P1 in this case) had just manoeuvered can easily be checked: by looking at a series of tle's issued around the time of interest (17 July 2014, 8:32 UT in this case), a manoeuvre around the time of interest would be visible by a sudden change in elements.

For Resurs P1 around 17 july 2014, I did this check (Kuramoto obviously didn't). There is no such change, i.e. the satellite did not make a significant manoeuvre. This can be seen in the diagrams below which depict the evolution of the orbit (from JSPOC data over July 2014). A manoeuvre would show up as a clear discontinuity (a clear sudden change) in either perigee and/or apogee altitude, argument of perigee, inclination, Mean Motion and /or RAAN (and notably in RAAN for Kuramoto's argument to hold). Tampering with the orbital elements around 17 July by JSpOC would show up similarly, by the way. But none of this happens, as you can see below. So again, Kuramoto's next grasp at a straw, is futile, and by now his attempts to argue my analysis away are bordering the pathetic.


post-edit  24 Feb 2014, 15:05 UT:

Kuramoto is still trying to advance his ill-fated argument:


Again, his argument is largely irrelevant. The kind of deviations pointed out are very minor: a maximum error of 9.3 km in position at a given time really will not significantly change the viewing angles. That would need cross-track errors an order of a magnitude larger.

post-edit 24 Feb 2014, 15:40 UT:

Well now, somebody has seen the light it appears:

Saturday, 13 February 2016

Continuing to track NROL-45 (FIA Radar 4)

(click image to enlarge)

The image above shows FIA Radar 4 (2016-010A), the payload of the NROL-45 launch of 10 Feb 2016, crossing through Corona Borealis around 6:26 am local time  (5:26 UT) this morning (Feb 13) 3 days after launch.

It was about 6.5 seconds late on our very preliminary orbit. A new (hopefully) improved estimate of the orbit is here.

The SAR panels of the satellite do not seem to have deployed yet: the object is still relatively faint. This is normal: the panels are deployed a few days after the launch, based on patterns of earlier FIA Radar launches.

Thursday, 11 February 2016

Observing NROL-45 (FIA Radar 4/TOPAZ 4) 18 hours after launch

NROL-45, imaged 18 hours after launch
(click to enlarge)

Yesterday (10 Feb 2016) at 11:40:32 UT, the NRO launched a new classified satellite from Vandenberg AFB, using a Delta-IV M rocket, under the launch designation NROL-45. The payload is the fourth FIA Radar (also known under the codename TOPAZ) and has the alternative designation USA 167 USA 267.

As with previous launches, our network of observers picked the payload up quite quickly. The first optical observations were made near 03:39 UT (11 Feb 2016), 16 hours after launch, by Cees Bassa in the Netherlands. Some two hours later, on the next pass, Leo Barhorst and me (both also in the Netherlands) observed NROL-45 as well, 18 hours after launch.


orbit of NROL-45, and position at time of photo
(click to enlarge)

A first preliminary orbit is given here and here. The satellite moves in a 122.98 degree inclined, retrograde orbit with perigee near 1086 km and apogee near 1087 km. The retrograde orbit is a clear indication that this satellite is a SAR (radar) satellite.

I did my observations under a very clear early morning sky, near 6:20 am local time. The NROL-45 payload was faint and could not be seen by the naked eye: this is normal during the first few days after launch. It will become brighter in a few days, likely because the SAR panel has then been unfolded.

With the launch of FIA Radar 4, there are now four FIA radars on orbit. Launch of a 5th one is expected in 2017. Of the current four satellites, the orbital configuration is such that the RAAN are 90 degree separated (see discussion by Ted Molczan here).

current FIA Radar constellation. NROL-45 in yellow.
(click to enlarge)

Sunday, 7 February 2016

Inconsistent DPRK versus JSPoC orbit claims for Kwangmyŏngsŏng 4

This post is a brief update to my more elaborate post of earlier today here.

As I wrote in that post, western military tracking of the N-Korean satellite places it in an orbit with perigee at 465 km, apogee at 502 km and an orbital inclination of 97.5 degree.

It is interesting to compare this with the (English) radio announcement of the DPRK itself, which you can hear here.

In that bulletin, the orbit is given as having perigee at "494.6 km", apogee at "500 km", and an orbital inclination of "97.4" degrees.

Compare this to JSpOc data: 465 km, 502 km, 97.5 degrees.

The DPRK apogee perigee altitude does not match the JSpoC data, which gives a clearly lower apogee perigee at 465 km. This could in theory be due to initial errors in the JSpOC tracking data (the first few orbit determinations are always less accurate). But the magnitude of the difference is such, that I doubt that.

Assuming that the numbers in the DPRK radio bulletin are not based on actual North-Korean tracking data, but instead based on a pre-launch desired orbit, then maybe this could indicate that the satellite did end up in a slightly lower orbit than intended.

We'll see if the difference keeps standing with more western tracking data added...

[update: Jonathan McDowell suggested that perhaps the Koreans used another spheroid (earth shape) to refer to. I doubt that: not only would I expect similar discrepancies in the apogee altitude as well in this case (the apogee altitudes given by JSpOC and N-Korea are close), but moreover, 30 km is a large difference. I know of no ellipsoid that differs by as much as 30 km from the WGS84 ellipsoid]

[update 2:  Bob Christy makes some very interesting remarks on his webpage, which also support the idea that orbit insertion did not go as intended].

North Korea has launched Kwangmyŏngsŏng 4

Launch of KMS-4 (still from N-Korean tv announcement)

My previous blogpost of Feb 4 (with an update on Feb 5) discussed the announced launch of a new North Korean satellite, Kwangmyŏngsŏng-4 (KMS-4), from Sohae satellite Launch center in the northwest of North Korea.

Yesterday (Feb 6), North Korea suddenly shifted the start of the launch window one day forward, from February 8 to February 7 (local date). No reason was given for this date shift.

The actual launch happened this morning at 00:29 UT (February 7, 2016), according to USSTRATCOM.

It appears to have been successful, to the extend that  they did successfully put an object into orbit, as the US military tracking network confirms. As the history with KMS 3-2 shows, whether the payload is really operational is another question and as for yet unanswered.

North Korean television announced the successful launch a few hours ago, in a bulletin in characteristic fashion, including images of the launch and of Kim Jong-Un watching the launch from Sohae:


Launch time

The launch time prediction of my previous post (and in this seesat list post) turns out to have been correct.

I indicated a launch between 00:24 and 00:41 UT (a 17 minute period out of a 5 hour window indicated by the North Koreans). The start of this window at 00:24 UT was based on the assumption of a launch at a similar solar elevation at Pyongyang as during the 2012 launch of KMS 3-2 (the end at 00:41 UT was based assuming a launch exactly 5 2 hours after Pyongyang sunrise rather than at a similar solar elevation to 2012).

The actual launch occurred at 00:29 UT, only a few minutes from the start of the window which I indicated. It corresponds to a solar elevation of 18.0 degrees at Pyongyang (the 2012 launch happened at a solar elevation of 17.5 degrees).


Orbit

The first orbital elements from JSpOC show two objects in orbit as a result of the launch: an A-object (catalogue number 41332, 2016-009A) and a B-object (catalogue number 41333, 2016-009B). The A-object is likely the satellite.


The A-object moves in  a 97.5 degree inclined, 465 x 502 km sun-synchronous polar orbit with an orbital period of 94.3 minutes. The satellite makes daily morning passes around ~9h am. It has a repeating ground-track every 4th day. This is consistent with a remote-sensing role.

The orbit is somewhat lower and  more circular than that of North Korea's previous satellite, KMS 3-2, which was initially placed in a 495 x 588 km orbit. Like the 2012 launch, North Korea had to perform a dogleg manoeuvre to attain an orbital inclination of 97.5 degrees after launching due south from Sohae (see discussion in my previous post).

The second, B object is the spent upper stage of the rocket, and is moving in a 433 x 502 km orbit.

The map below shows the satellite's ground-track during the first 5 orbits after launch:


North Korea's ruler Kim Jong-Un watched the launch from the grounds of the Sohae Satellite Launch Center. In the image below, he is observing the rocket ascend from a viewing platform which appears to be in front of the oval building that was erected at Sohae between March and July 2014 (see this satellite photo analysis on the 38 North blog).


A few more stills of the launch, taken from the North Korean tv broadcast:


The launch of Kwangmyŏngsŏng 4 is the second time that the North Korean rocket program was successful in placing an object in orbit. North Korea itself claims a number more successful launches, but these failed according to western sources as no objects were tracked in orbit.

Current spatial separation of the orbital planes of KMS 3-2 and KMS 4

Note added 18:00 UT, 7 Feb: a brief update noting inconsistencies between early western tracking data and a DPRK announcement is here.

Thursday, 4 February 2016

[UPDATED] North Korea's upcoming satellite launch

North Korea's previous satellite, Kwangmyŏngsŏng 3-2, imaged in 2015
(click image to enlarge)

On February 8th, 2016, it will be the 70th anniversary of the formation of the Provisional People's Committee for North Korea by Kim Il-Sung, effectively marking the birth of the nation. And 16 February 2016 will be the 74th (actually 75th) birthday of the late Kim Jong-Il, while in addition February 14th is a day that commemorates Kim Jong-Il assuming the role of "Grand General of the DPRK". Such dates often see some significant national posturing of North Korea.

Following a nuclear test on January 6th (claimed to be a small H-bomb by the North Koreans, although western observers doubt this), North Korea has announced the launch of a satellite, with issued Broadcast Warnings pointing to a launch between February 8 and 25. The launch period starts at the date of the 70th anniversary of the Provisional People's Committee.  

Satellite image analysts at the 38 North website had already been documenting preparations for a launch at the launch site in Sohae in January. Over the past 3 year, North Korea had been making several improvements to its launch installations, building various new structures on the site.

Meanwhile, the upcoming launch has western nations and neighbouring states concerned. Especially Japan has expressed very strong concerns about the launch. Like they did in 2012, they have threathened to shoot the rocket down if it seems to be headed for Japan. That is unlikely to happen though.

The Broadcast Navigational Warnings issued delineate three splash-down areas of rocket debris:

HYDROPAC 294/16
WESTERN NORTH PACIFIC.
YELLOW SEA.
EAST CHINA SEA.
PHILIPPINE SEA.
ROCKETS.
DNC 23.
1. HAZARDOUS OPERATIONS 2230Z TO 0330Z COMMENCING
   DAILY 07 THRU 24 FEB IN AREAS:
   A. BETWEEN 35-19N 36-04N AND 124-30E 124-54E.
   B. BOUND BY
      33-16N 124-11E, 32-22N 124-11E,
      32-21N 125-08E, 33-16N 125-09E.
   C. BOUND BY
      19-44N 123-53E, 17-01N 123-52E,
      17-00N 124-48E, 19-43N 124-51E.
2. CANCEL THIS MSG 250430Z FEB 16
.

[added note: the original letter of North Korea to the Int. Maritime Organization on which this navigational warning is based, is here].

Area A is the splash-down area for the first stage, area B for the fairings, and area C for the second stage (the third stage will remain on-orbit after launch). Plotting these on a map (red boxes in map below) reveals them to be on a north-south line with azimuth ~180 degrees (yellow line), avoiding the main islands of Japan:

(click map to enlarge)

The ~180 degree launch azimuth points to a satellite launch into Polar orbit, very similar to the launch direction of North Korea's previous satellite, Kwangmyŏngsŏng (KMS) 3-2 (2012-072A) three years ago (a nice background piece on that launch by Brian Weeden discussing "satellite launch or missile test?" can be found here). Compare my map above to the map constructed from the NOTAM's for the KMS 3-2 launch in 2012 on Bob Christy's website, [edit: and see also the comparison of 2012 to 2016 in this blogpost by Melissa Hanham on the Arms Control Wonk blog].

As was the case with their previous KMS 3-2 launch, the intended satellite orbit is, given the launch direction, likely a sun-synchronous orbit with an orbital inclination of 97 degrees. The launch direction due south rather than directly into a ~97 degree inclined orbit has been chosen to avoid overflying (and debris landing on) the territories of China and Taiwan during the ascend phase. In order to reach a true sun-synchronous orbit with inclination ~97 degrees, it necessitates a dog-leg manoeuvre of the third stage with payload during the final phase of the ascend to orbit (blue line in map above, approximate only). Orbit insertion of the payload will be about ten minutes after launch, just before reaching the Phillipines.

Assuming the resulting orbit of the satellite will be similar to that of KMS 3-2 in 2012 (perigee ~495 km, apogee ~588 km, inclination 97.4 degrees), the trajectory of its first revolution around earth will look something like this (yellow dot shows satellite position one hour after orbit insertion):


(click map to enlarge)

The launch window is 17 days long, and runs daily from 22:30 to 03:30 UT, according to the Broadcast Warning. The daily 22:30-03:30 UT window is similar to that of the KMS 3-2 launch in 2012. It runs from local daybreak to just short of local noon, indicating a desire for an orbital plane resulting in morning passes.

[edit: the paragraph below was slightly editted on 5 Feb 2016, expanding the discussion of possible launch times]

In 2012, KMS 3-2 was launched at 00:49:49 UT, almost exactly two hours after Pyongyang sunrise (22:50 UT). This suggests (if a similar orbital plane with overfly times at ~9h am local time is aimed for) that the current launch might happen somewhere between 00:24-00:41 UT, depending on whether the aim is for launch at a similar solar elevation (then it will be close to 00:24 UT) or merely two hours after Pyongyang sunrise (then it will be close to 00:41 UT). However (see the next paragraph), the timing of the 2012 launch also seems to have been (at least partially) dictated by a suitable window lacking overflights by western reconnaissance satellites. As for the date, I hesitate to prophecy on this, but I wouldn't be surprised if they go - weather permitting- for February 8, the first day in the 17-day window.

It appears that the North Koreans carefully chose their launch moment in 2012. US military sources already had claimed shortly after the launch that North Korea had played a ruse on them and evidently knew when western optical imaging satellites had (and had not had) view of the launch installations. This seems to be confirmed by my independent analysis of that launch from December 2012, which showed that the North Koreans used the very end of a longer-than-usual one-hour gap in IMINT coverage of the launch site to launch. And as I wrote in that blog post, a North Korean IP address had been looking for orbital elements of  US optical and radar satellites on this very blog just days before the launch.

The ruse was apparently designed to keep the USA, Japan and South Korea in the dark about the launch moment until the actual moment of launch itself (which would be registered by SBIRS and DSP satellites), as a counter-measure to give potential intercepts of the rocket as little advance preparation time as possible.

It would be difficult for North Korea to repeat such a ruse these days, as the number of western optical and radar reconnaissance satellites has grown ubiquitously in the past three years. Assuming launch near 00:40 UT (two hours after sunrise), the most promising dates (from the perspective of relative lack of western IMINT coverage) are three dates in the first week of the launch window:  February 8, 10 and 14. But maybe North Korea is confident enough this time, following the experience with KMS 3-2, to not bother with western IMINT coverage at all.

Tuesday, 2 February 2016

Back to basics: AEHF 2 and SBIRS GEO 2 imaged

click to enlarge

Time to go back to basics. The photo above is part of an image I shot in the evening of January 20-21, 2016. It shows a number of commercial geosynchronous satellites and two classified satellites: AEHF 2 and SBIRS-GEO 2.

This image was shot from Leiden center using a Canon EOS 60D and a Zeiss Sonnar 2.8/180 mm lens and 15 seconds exposure (ISO 1000). It shows an approximately 2.5 degree wide field in Hydra, just east of alpha Hydra. The sky was extremely transparent, and to my surprise a waxing moon in the sky was no real hindrance: conditions I do not encounter often!

Most prominent on the image (a crop out of a larger image) is the commercial Astra 1 group, a group of four satellites well known to European owners of satellite tv dishes. Just north of the group is AMOS 5, an Israeli commercial communications satellite. It suffered a malfunction on 21 November 2015, as a result of which all contact was lost.

Also visible in the image are the commercial satellite Arabsat 5C and the Chinese satellite Tianlian 1-03. The latter satellite is a Tracking- and Data Relay satellite that plays a similar role to the US TDRS satellites. The Tianlian satellites are specifically meant to relay data to and from Chinese crewed Shenzou spacecraft.

Two classified US satellites are visible in the image.

On the right is AEHF 2 (2012-019A), the second Advanced Extremely High Frequency military communications satellite. The AEHF system is a replacement for the older Milstar system, and use of this US system is shared by the military of a number of  countries, at this moment the UK, Canada, and my own country, the Netherlands. It is eventually to consist of 6 satellites, of which 3 have been launched as of early 2016. The satellites have been designed to be resilient to jamming and intercept efforts.

On the left is SBIRS GEO 2 (2013-011A), the second geostationary satellite in the Space Based Infra Red System, a series of US infra-red Early Warning satellites meant to detect missile launches. I discussed this system in detail in several recent blogposts, as this system might have played a role in potentially detecting the missile that shot down Malaysian Airlines flight MH17. Indeed, the satellite imaged here, SBIRS GEO 2, is one of the SBIRS satellites that had sight on the Ukraine at that time.